


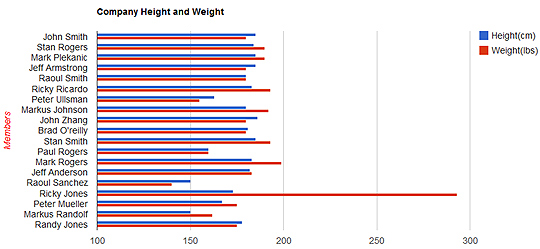
The example below takes the names, height and age from a database table and outputs it into a simple chart. The original chart was a yearly chart which displayed year, sales and expenses. The key to this example, is to get the desired code into the Javascript.
Here is what we want to change:
var data = google.visualization.arrayToDataTable([
[‘Year’, ‘Sales’, ‘Expenses’], [‘2004’, 1000, 400], [‘2005’, 1170, 460], [‘2006’, 660, 1120], [‘2007’, 1030, 540] ]);
Here is what we want to change it to:
var data = google.visualization.arrayToDataTable([
[‘Name’, ‘Height’, ‘Weight’],
<?php echo implode(“,”, $myurl); ?>
]);
<?php
session_start();
include(‘connect.inc’);
$db=public_db_connect();
//get columnname id
$command = “SELECT firstname, lastname, height, weight FROM table_sort WHERE height<>’’ AND weight<>’’ “;
$result = mysqli_query($db, $command);
while ($row = mysqli_fetch_assoc($result)) {
$firstname = trim(addslashes($row[‘firstname’]));
$lastname = trim(addslashes($row[‘lastname’]));
$height = $row[‘height’];
$height = preg_replace(‘/\D/’, ‘’, $height);
$weight = $row[‘weight’];
$weight = preg_replace(‘/\D/’, ‘’, $weight);
$myurl[] = “[‘”.$firstname.” “.$lastname.”’, “.$height.”,”.$weight.”]”;
}
print_r($myurl);
echo implode(“,”, $myurl);
?>
<html>
<head>
<script type=”text/javascript” src=”https://www.google.com/jsapi”></script>
<script type=”text/javascript”>
google.load(“visualization”, “1”, {packages:[“corechart”]});
google.setOnLoadCallback(drawChart);
function drawChart() {
var data = google.visualization.arrayToDataTable([
[‘Name’, ‘Height’, ‘Weight’],
/* [‘2004’, 1000, 400],
[‘2005’, 1170, 460],
[‘2006’, 660, 1120],
[‘2007’, 1030, 540]*/
<?php echo implode(“,”, $myurl); ?>
]);
var options = {
title: ‘Company Height and Weight’,
vAxis: {title: ‘Members’, titleTextStyle: {color: ‘red’}}
};
var chart = new google.visualization.BarChart(document.getElementById(‘chart_div’));
chart.draw(data, options);
}
</script>
</head>
<body>
<div id=”chart_div” style=”width: 900px; height: 500px;”></div>
</body>
</html>

Owner of Fullstack Web Studio

Quality Coding

Digital Marketing
When Performance and Flexibility Matters
Affordable web design,custom web development and mobile apps for individuals and businesses.


Let us analyze your data and competition to acquire more traffic! Professional SEO content writer
© 2018 ALL Rights Reserved | Sitemap
Vancouver | North Vancouver | Burnaby | Richmond | Coquitlam | Port Coquitlam | Surrey | Langley | Maple Ridge | Mission | Abbotsford | Kamloops | Kelowna | Victoria | Squamish | Whistler | Pemberton